
The Corso Data Stack
Modern data infrastructure has become quite complex. Companies need to ingest data from multiple sources, store it, process it, and otherwise make it useful. To do so they lean on data architects, data engineers, data scientists, and data analysts to wrangle everything together. These different roles work with data warehouses, data marts, data lakes, and even data lakehouses.
There's quite a few different approaches to the process, and countless tools have cropped up around solving these various problems. All major cloud providers have dedicated products and solutions for handling data at massive scale, and there are multiple companies pitching their solutions for storing, pipelining, observing, validating, and testing your data.
The Corso Philosophy
The way Corso builds software reflects our specific needs and experience, and our data architecture is also specific to Corso. Everyone's needs are different, but perhaps some elements of our strategy and implementation can be useful to you in your circumstances.
At Corso simplicity is a core principle, especially on our engineering teams. Our software has been architected to be boring. We use technologies that are battle tested, and we keep the number of moving pieces to a minimum.
We use Postgres as our primary application database, as Postgres is possibly the poster child for a boring technology. Our architecture is mostly monolithic, meaning the number of databases we need to manage is small. We keep business logic out of the database engine, but we use constraints liberally and architect our data to be well-normalized with high expectations of data integrity.
Because all the data in our application database is highly structured, we designed the rest of our data stack to take advantage of that structure. We recognize though that the competing goals of OLTP vs OLAP mean that it's challenging (if not impossible) to run heavy analytical workloads directly against a well-normalized database optimized for application data storage.
Our Data Architecture
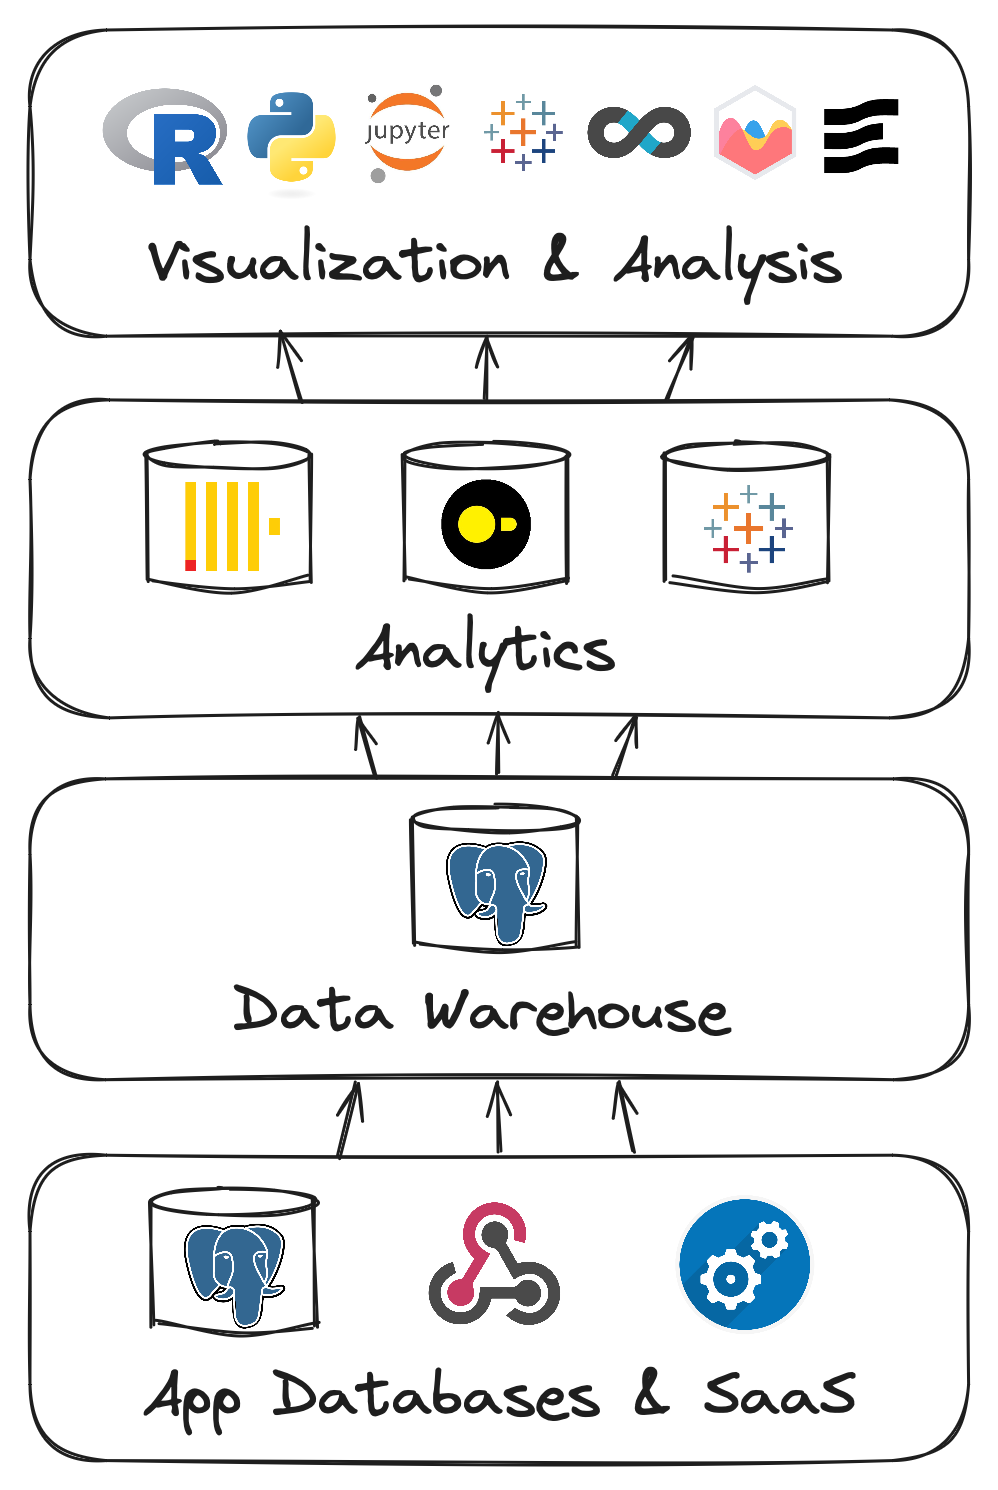
Under this philosophy, we felt that it made sense for there to be 3 layers to our data storage:
1. Application Data
Our application data lives in dedicated databases optimized for OLTP workloads. These databases generally follow best-practices for data modeling, with a well-normalized schema and data integrity a primary concern. We use various features such as custom types, constraints, and optimized indexes.
Our application databases add hundreds of thousands of records every day. Since our applications are really only concerned with the most recent 60 days of data in most cases, we can optimize performance by keeping a "working set" of data rather than keeping every record since Corso was started.
To offload the data outside of our working set, we have our next layer:
2. Data Warehouse/Long-Term Persistence
This middle layer has two purposes: act as the source of truth for the next layer up (the analytics layer), and act as cold storage of sorts for our application database.
Although we call this layer our "Data Warehouse", it doesn't particularly resemble a traditional Enterprise Data Warehouse (EDW) such as you might see with Microsoft's SSAS or Oracle's OLAP. The structure closely follows that of our application database, and avoids trying to rework the data into a star or snowflake schema. Most of the reasons for this type of EDW aren't useful in our 3-layer approach.
There is data in the warehouse from other sources such as our CRM, customer service ticketing, financial data, etc. Being able to query operational, financial, and sales data together because they are all in the same system is a big advantage.
There are very few constraints in our data warehouse, since we let the application databases do all the work of enforcing data integrity. This allows inserts to be very fast, but this can come at the cost of slower querying since the use of indices is more minimal.
This works out OK though, because we don't often query directly against the data warehouse. Instead we have our next layer for that:
3. Analytics
As needed depending on context, data is pulled from our warehouse into the different parts of our analytics layer. The data warehouse has several views that allow easy retrieval of data into different analytics systems. There are SQL views that construct a complete record of different entities in the system, creating pre-joined, tabular data that is easily retrieved with simple queries.
There are a few database components to our analytics layer depending on the need:
- Tableau Cloud - Much of our internal analytics and reporting is performed with Tableau. Tableau cloud natively stores its own copy of the data it needs, and queries it directly.
- DuckDB - DuckDB is a local, in-process analytics database engine. It is often referred to as the SQLite of analytics, since it is run and queried locally rather than across a network as is often the case with other types of database. This makes DuckDB ideal for ad-hoc exploratory analytics, such as those you might do with a Jupyter notebook.
- Clickhouse - Most of our merchant-facing analytics is performed with Clickhouse. This data is kept in flat tables that mirror the views composed in the data warehouse. This minimizes the number of joins to be performed, allowing speedy data retrieval. Clickhouse is FAST, which means that our merchants can get the data they need in a hurry.
Tableau and Clickhouse are both kept continually in sync with data that is generally only a few seconds behind our applications.
Any data used in DuckDB is initially populated from the data warehouse, and then refreshed/reloaded as needed.
Data Visualization
Above these data storage layers are the tools that actually surface the data and make it useful. There's a wide range of tools we use depending on who we are trying to show the data to, and some of these tools do quite a bit of analysis on their own.
- Tableau: We are big Tableau fans. Tableau probably balances power and usability better than any other tool out there, and makes data exploration fun and easy.
- Jupyter: Jupyter (and the languages and libraries it allows you to use) has a significant learning curve, but it's hard to beat the power and flexibility of the notebook interface. The huge python data ecosystem available brings AI/ML, visualization, and advanced data processing right to your laptop or workstation.
- Evidence.dev: This BI tool renders a full set of reports into a self-contained, pre-built page. No spinning wheel waiting for your dashboard to load. This approach makes for great automated delivery of point-in-time reports, which dashboarding tools like Tableau don't do as well.
- Superset: Part of the Apache data stack, Superset is perhaps most simply described as an open-source, web-only competitor to Tableau. This project grew out of AirBnB to become a popular way to build and display generalized data.
- Custom charting: Sometimes when you want something done in exactly the right way, you have to do it yourself. Or rather, use a library to do it yourself. Or maybe you just need a chart or two sprinkled here and there. When this is the case, we reach for libraries like chart.js and Apache ECharts.
Conclusion
Corso tries to keep things simple, avoid Not Invented Here syndrome, and maintain structured data all the way up and down our stack. This has a small amount of overhead since we have to think about how data will be displayed to a user all the way back at the point of ingesting a web hook, but the payoff is a much more integrated and resilient data stack.
Discussions of ELT vs. ETL, how a data pipeline is constructed, and what types of analysis you can provide all become much easier under an a simplified approach like this. The higher up the stack you can push any decisions about distinct representations of your data, the more standardized all of your tools can be.
The end result? Easy reasoning about our data for anybody on the product and engineering teams, and our merchants get dashboards that are within a few seconds of live data, and easy implementation of new charts and analytics.